IoD data aggregated to Middle layer Super Output Area
Author
Just Knowledge Team
Published
June 8, 2026
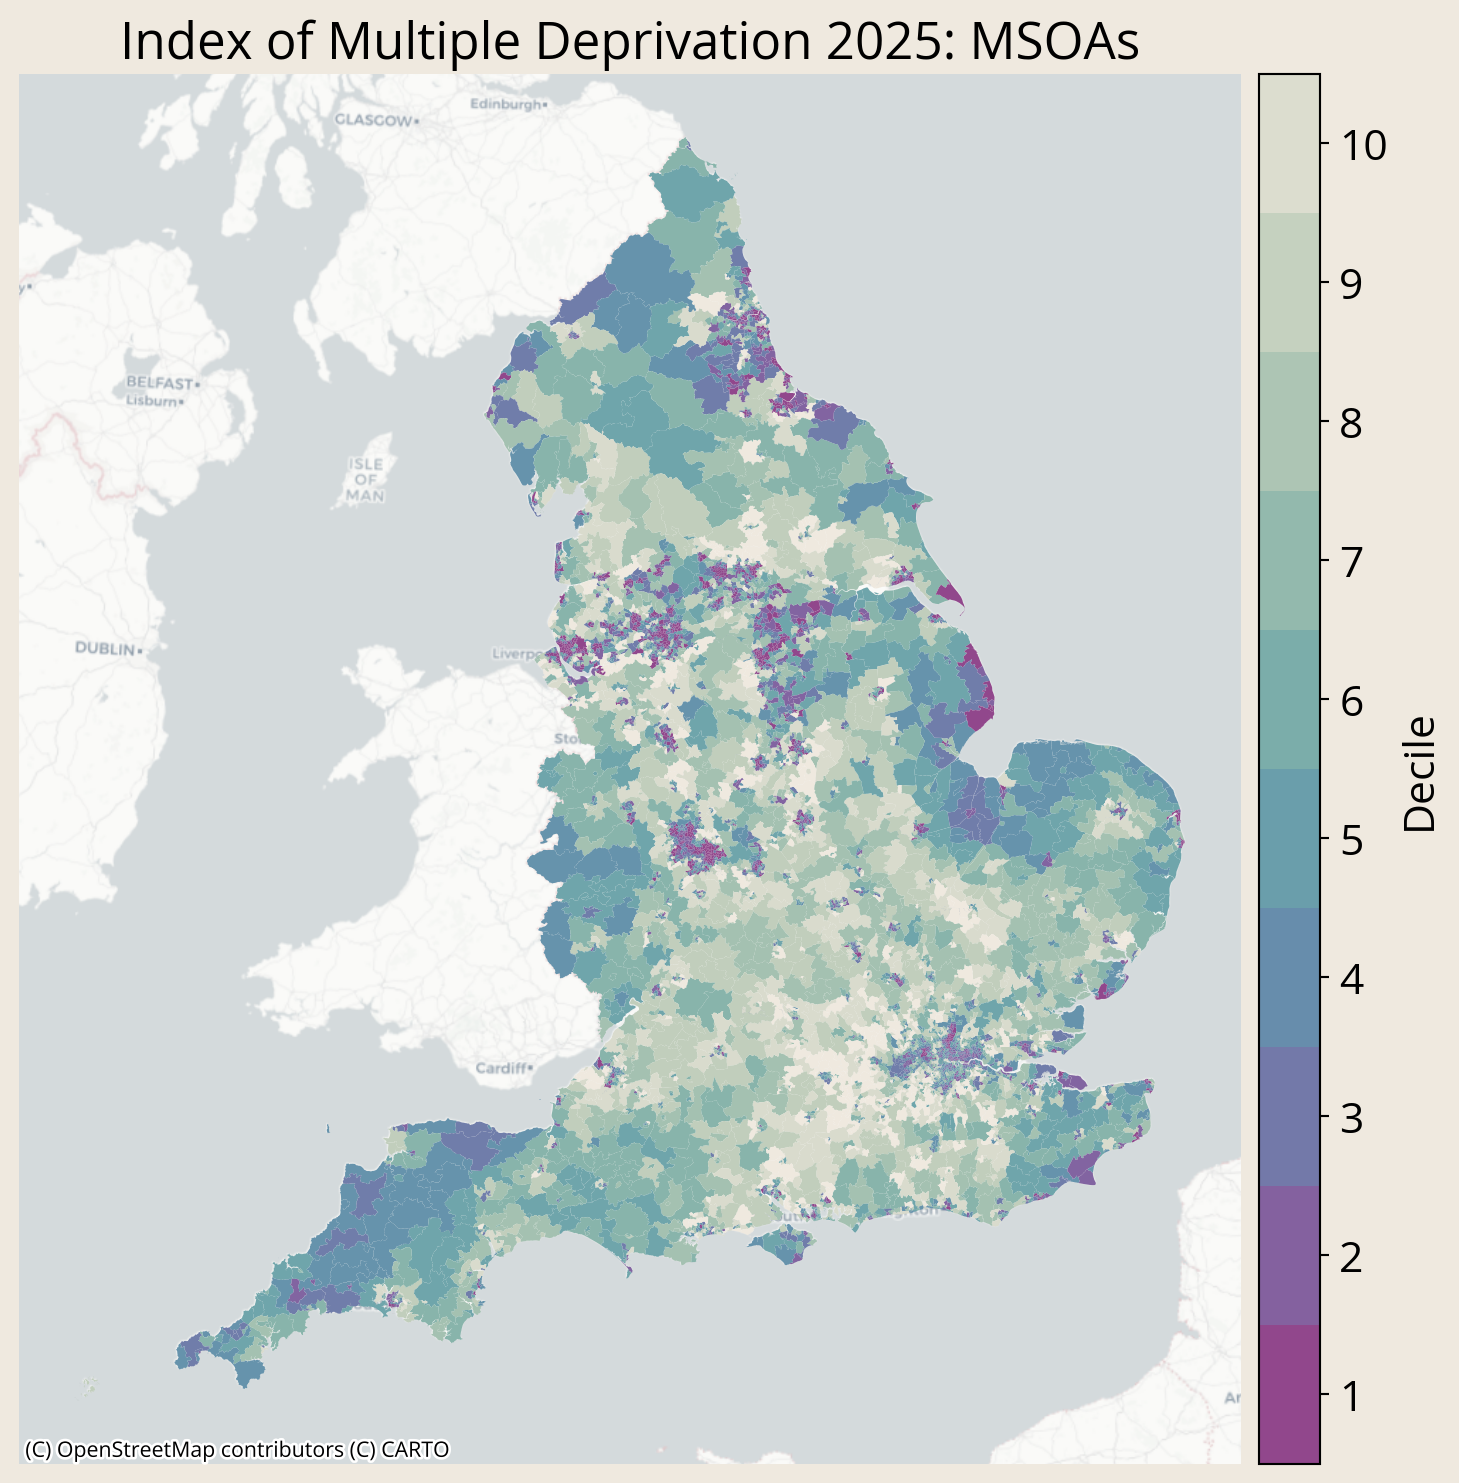
New Indices of Deprivation 2025 Data: MSOA level
27 November 2025
New Indices of Deprivation data were released in November 2025. These data provide measures of deprivation in areas relative to other areas in England. The data have been published for Lower layer Super Output Areas (LSOAs) and Local Authority Districts, as well as other area types. However, we’ve noticed that the data haven’t been published at Middle layer Super Output Area (MSOA).
In our recent project Understanding Poverty in Place, we aggregated deprivation data to MSOA level (the estate of Northumberland Park can be defined as a single MSOA), and we’d like to share this aggregated dataset in case it’s of use to others.
Creating population weights for each LSOA by dividing the population of each LSOA by the total population of its corresponding MSOA (note some population denominators are specific populations, e.g. children, older people, employed people)
Multiplying the LSOA deprivation scores by their population weights
Summing the weighted scores of LSOAs for each MSOA
The result is a population-weighted score for each MSOA, where each LSOA’s contribution is weighted by how big its population is relative to the MSOA’s total population.
For each deprivation metric, we then ranked the MSOAs and allocated each MSOA to a decile, where lower ranks and deciles correspond to greater deprivation.
Below is the code used to aggregate the LSOA data to MSOA.
Code for Nerds
# Preliminariesimport psycopg2import configparserimport osimport requestsimport pandas as pdfrom sqlalchemy import create_enginefrom sqlalchemy import create_engineimport janitorimport pickle# Load DB configconfig = configparser.ConfigParser()config.read(os.path.join('..','db_config.ini'))db_params =dict(config['postgresql'])# Build SQLAlchemy connection stringconn_str = (f"postgresql+psycopg2://{db_params['user']}:{db_params['password']}"f"@{db_params['host']}:{db_params['port']}/{db_params['database']}")# Create engineengine = create_engine(conn_str)# Get Iod Data from sourcedata_dir = os.path.join('data')filepath = os.path.join(data_dir, 'iod25.csv')url ='https://assets.publishing.service.gov.uk/media/68ff5daabcb10f6bf9bef911/File_7_IoD2025_All_Ranks_Scores_Deciles_Population_Denominators.csv'if os.path.isfile(filepath)==False: response = requests.get(url)withopen(filepath, 'wb') asfile:file.write(response.content)# else:# print('Data already acquired. Loading it.')iod25 = pd.read_csv(filepath)# Clean column namesiod25 = janitor.clean_names(iod25)iod25.columns = iod25.columns.str.strip('_')domains_of_interest = ['index_of_multiple_deprivation','income','employment','education_skills_and_training','health_deprivation_and_disability','crime','barriers_to_housing_and_services','living_environment','income_deprivation_affecting_children','income_deprivation_affecting_older_people','children_and_young_people_sub-domain','adult_skills_sub-domain','geographical_barriers_sub-domain','wider_barriers_sub-domain','indoors_sub-domain','outdoors_sub-domain',]def clean_domain_name(domain):return domain.replace('_', ' ').title()domain_dict = {domain: clean_domain_name(domain) for domain in domains_of_interest}# Reorder columnscols = [ col for col in iod25.columnsif'score'in colandany(domain in col for domain in domains_of_interest)]population_cols = [ col for col in iod25.columns if ('population'in col)or ('dependent_children'in col)]iod25 = iod25.rename( columns = {'lsoa_code_2021': 'lsoa21cd','lsoa_name_2021': 'lsoa21nm','local_authority_district_code_2024': 'lad24cd','local_authority_district_name_2024': 'lad24nm', })iod25 = iod25[['lsoa21cd','lsoa21nm','lad24cd','lad24nm'] + cols + population_cols]# Get the lookup from LSOA to MSOA. This is from our DB. # Lookups are available at ONS geoportal, e.g. https://geoportal.statistics.gov.uk/datasets/45fdd4465604493cb7d2238ad642172b_0/explorefilepath = os.path.join(data_dir, 'lsoa_msoa21_lookup.pkl')ifnot os.path.isfile(filepath):with engine.connect() as con: query ='''SELECT DISTINCT lsoa21cd, msoa21cd FROM pcode_census21_lookup ''' lookup21 = pd.read_sql(query, con = con)withopen(filepath, 'wb') asfile: pickle.dump(lookup21, file)else:withopen(filepath, 'rb') asfile: lookup21 = pickle.load(file)iod25_msoa = iod25.copy()iod25_msoa = iod25_msoa.merge(lookup21, how='left', on='lsoa21cd') cols = iod25_msoa.columns[iod25_msoa.columns.str.contains('score')]# Note - denominator may need to be different for particular domains# Create a dictionary to index the correct population column# These are metrics with specific denominatorsspecial_cols = ['income_deprivation_affecting_children_index_idaci_score_rate','income_deprivation_affecting_older_people_idaopi_score_rate','employment_score_rate']# These are the metrics with the general pop denominatornormal_cols = [col for col in cols if col notin special_cols]# Map the special metrics to specific denomspop_dict = {'income_deprivation_affecting_children_index_idaci_score_rate': 'dependent_children_aged_0_15_mid_2022','income_deprivation_affecting_older_people_idaopi_score_rate': 'older_population_aged_60_and_over_mid_2022','employment_score_rate': 'working_age_population_18_66_for_use_with_employment_deprivation_domain_mid_2022'}# Map the normal metrics to the total pop denomtemp_dict = {col: 'total_population_mid_2022'for col in normal_cols}# Add the two dictspop_dict.update(temp_dict)# Multiply each score by populationfor col in cols: population_col = pop_dict[col]# print(col)# print(population_col) iod25_msoa[col +'_weighted'] = iod25_msoa[col] * iod25_msoa[population_col]# Group by MSOA and sum the weighted scores and populationgrouped = iod25_msoa.groupby(['msoa21cd','lad24cd','lad24nm']).agg( {col +'_weighted': 'sum'for col in cols} | {'total_population_mid_2022': 'sum','dependent_children_aged_0_15_mid_2022': 'sum','older_population_aged_60_and_over_mid_2022': 'sum','working_age_population_18_66_for_use_with_employment_deprivation_domain_mid_2022': 'sum'}).reset_index()# Calculate weighted average, rank, and decilefor col in cols: avg_col = col +'_weighted_avg' rank_col = col +'_rank' decile_col = col +'_decile' population_col = pop_dict[col]# print(col + ': ' + population_col)# print(grouped[population_col]) grouped[avg_col] = grouped[col +'_weighted'] / grouped[population_col] grouped[rank_col] = grouped[avg_col].rank(method='min', ascending=False) grouped[decile_col] = pd.qcut(grouped[rank_col], q=10, labels=range(1, 11), duplicates='drop')# Select final columns to keepiod25_msoa = grouped[['msoa21cd','lad24cd','lad24nm'] + [col + suffix for col in cols for suffix in ['_weighted_avg', '_rank', '_decile']]]iod25_msoa.to_csv(os.path.join('data','iod25_msoa.csv'), index=False)
Source Code
---title: "New Indices of Deprivation 2025 Data: MSOA level"description: "IoD data aggregated to Middle layer Super Output Area"date: todaycategories: [data-analysis, place-based-change]echo: falsedraft: falseimage: "/assets/images/blog/imd25-msoa.png"code-tools: source: true toggle: true# code-fold: true# code-summary: "Code For Nerds"---# New Indices of Deprivation 2025 Data: MSOA level<div style="text-align: center;"><p><strong>*27 November 2025*</strong></p></div>```{python}# Preliminariesimport psycopg2import configparserimport osimport requestsimport pandas as pdfrom sqlalchemy import create_engineimport matplotlib.pyplot as pltfrom sqlalchemy import create_engineimport janitorimport matplotlib as mplimport pickleimport geopandas as gpdimport matplotlib.colors as mcolors# Load DB configconfig = configparser.ConfigParser()config.read(os.path.join('..','db_config.ini'))db_params =dict(config['postgresql'])# Build SQLAlchemy connection stringconn_str = (f"postgresql+psycopg2://{db_params['user']}:{db_params['password']}"f"@{db_params['host']}:{db_params['port']}/{db_params['database']}")# Create engineengine = create_engine(conn_str)# Colourswithopen(os.path.join('..','assets','palettes', 'jk_primary_colours.txt'), 'r') asfile: jk_colours = [line.strip() for line infile]# ice swatchfilepath = os.path.join('..', 'assets','palettes', 'ice_swatch.txt')withopen(filepath, 'r', encoding='utf-8') asfile: ice_swatch = [line.strip() for line infileif line.strip()]# Make a colormapice_cmap = mcolors.LinearSegmentedColormap.from_list("ice", ice_swatch)ice_cmap_rev = mcolors.LinearSegmentedColormap.from_list("ice", ice_swatch).reversed()mpl.rcParams['font.family'] ='Open Sans'mpl.rcParams['font.size'] =16mpl.rcParams["figure.facecolor"] = jk_colours[0]``````{python}# Get Iod Data from sourcedata_dir = os.path.join('data')filepath = os.path.join(data_dir, 'iod25.csv')url ='https://assets.publishing.service.gov.uk/media/68ff5daabcb10f6bf9bef911/File_7_IoD2025_All_Ranks_Scores_Deciles_Population_Denominators.csv'if os.path.isfile(filepath)==False: response = requests.get(url)withopen(filepath, 'wb') asfile:file.write(response.content)# else:# print('Data already acquired. Loading it.')iod25 = pd.read_csv(filepath)# Clean column namesiod25 = janitor.clean_names(iod25)iod25.columns = iod25.columns.str.strip('_')domains_of_interest = ['index_of_multiple_deprivation','income','employment','education_skills_and_training','health_deprivation_and_disability','crime','barriers_to_housing_and_services','living_environment','income_deprivation_affecting_children','income_deprivation_affecting_older_people','children_and_young_people_sub-domain','adult_skills_sub-domain','geographical_barriers_sub-domain','wider_barriers_sub-domain','indoors_sub-domain','outdoors_sub-domain',]def clean_domain_name(domain):return domain.replace('_', ' ').title()domain_dict = {domain: clean_domain_name(domain) for domain in domains_of_interest}# Reorder columnscols = [ col for col in iod25.columnsif'score'in colandany(domain in col for domain in domains_of_interest)]population_cols = [ col for col in iod25.columns if ('population'in col)or ('dependent_children'in col)]iod25 = iod25.rename( columns = {'lsoa_code_2021': 'lsoa21cd','lsoa_name_2021': 'lsoa21nm','local_authority_district_code_2024': 'lad24cd','local_authority_district_name_2024': 'lad24nm', })iod25 = iod25[['lsoa21cd','lsoa21nm','lad24cd','lad24nm'] + cols + population_cols]``````{python}# Get the lookup from LSOA to MSOA. This is from our DB. # Lookups are available at ONS geoportal, e.g. https://geoportal.statistics.gov.uk/datasets/45fdd4465604493cb7d2238ad642172b_0/explorefilepath = os.path.join(data_dir, 'lsoa_msoa21_lookup.pkl')ifnot os.path.isfile(filepath):with engine.connect() as con: query ='''SELECT DISTINCT lsoa21cd, msoa21cd FROM pcode_census21_lookup ''' lookup21 = pd.read_sql(query, con = con)withopen(filepath, 'wb') asfile: pickle.dump(lookup21, file)else:withopen(filepath, 'rb') asfile: lookup21 = pickle.load(file)iod25_msoa = iod25.copy()iod25_msoa = iod25_msoa.merge(lookup21, how='left', on='lsoa21cd') cols = iod25_msoa.columns[iod25_msoa.columns.str.contains('score')]# Note - denominator may need to be different for particular domains# Create a dictionary to index the correct population column# These are metrics with specific denominatorsspecial_cols = ['income_deprivation_affecting_children_index_idaci_score_rate','income_deprivation_affecting_older_people_idaopi_score_rate','employment_score_rate']# These are the metrics with the general pop denominatornormal_cols = [col for col in cols if col notin special_cols]# Map the special metrics to specific denomspop_dict = {'income_deprivation_affecting_children_index_idaci_score_rate': 'dependent_children_aged_0_15_mid_2022','income_deprivation_affecting_older_people_idaopi_score_rate': 'older_population_aged_60_and_over_mid_2022','employment_score_rate': 'working_age_population_18_66_for_use_with_employment_deprivation_domain_mid_2022'}# Map the normal metrics to the total pop denomtemp_dict = {col: 'total_population_mid_2022'for col in normal_cols}# Add the two dictspop_dict.update(temp_dict)# Multiply each score by populationfor col in cols: population_col = pop_dict[col]# print(col)# print(population_col) iod25_msoa[col +'_weighted'] = iod25_msoa[col] * iod25_msoa[population_col]# Group by MSOA and sum the weighted scores and populationgrouped = iod25_msoa.groupby(['msoa21cd','lad24cd','lad24nm']).agg( {col +'_weighted': 'sum'for col in cols} | {'total_population_mid_2022': 'sum','dependent_children_aged_0_15_mid_2022': 'sum','older_population_aged_60_and_over_mid_2022': 'sum','working_age_population_18_66_for_use_with_employment_deprivation_domain_mid_2022': 'sum'}).reset_index()# Calculate weighted average, rank, and decilefor col in cols: avg_col = col +'_weighted_avg' rank_col = col +'_rank' decile_col = col +'_decile' population_col = pop_dict[col]# print(col + ': ' + population_col)# print(grouped[population_col]) grouped[avg_col] = grouped[col +'_weighted'] / grouped[population_col] grouped[rank_col] = grouped[avg_col].rank(method='min', ascending=False) grouped[decile_col] = pd.qcut(grouped[rank_col], q=10, labels=range(1, 11), duplicates='drop')# Select final columns to keepiod25_msoa = grouped[['msoa21cd','lad24cd','lad24nm'] + [col + suffix for col in cols for suffix in ['_weighted_avg', '_rank', '_decile']]]iod25_msoa.to_csv(os.path.join('data','iod25_msoa.csv'), index=False)``````{python}#| include: false# a quick sanity check that ranks are lower for higher scorestest_cols = [col for col in iod25_msoa.columns if'index_of_multiple_deprivation_imd'in col]test = iod25_msoa[['msoa21cd'] + test_cols]test.sort_values([col for col in test.columns if'weighted_avg'in col])``````{python}# Get msoa geometries and lookup for plotting the data on a mapfilepath = os.path.join(data_dir,'msoa_geometries.pkl')if os.path.isfile(filepath)==False:with engine.connect() as con: query =''' WITH lookup AS ( SELECT DISTINCT msoa21cd, lad21cd FROM pcode_census21_lookup) SELECT lookup.*, foo.geometry FROM msoa21_boundaries foo LEFT JOIN lookup ON foo.msoa21cd = lookup.msoa21cd ''' msoa_geometries = gpd.read_postgis(sql=query, con=con, geom_col='geometry')withopen(filepath, 'wb') asfile: pickle.dump(msoa_geometries, file)else:withopen(filepath, 'rb') asfile: msoa_geometries = pickle.load(file)iod25_msoa_gpd = msoa_geometries.merge(iod25_msoa, how='right', on='msoa21cd')``````{python}# Plot the MSOA map as an illustrationfrom mpl_toolkits.axes_grid1.axes_divider import make_axes_locatableimport contextily as cxfig, ax = plt.subplots(figsize=(8,8))target_variable ='index_of_multiple_deprivation_imd_score_decile'# Data rangetarget_max = iod25_msoa_gpd[target_variable].max()target_min = iod25_msoa_gpd[target_variable].min()target_range = target_max - target_min +1# Create discrete colormapcolors = [ice_cmap_rev(i/target_range) for i inrange(target_max)] # sample 10 discrete colors - using i/9 ensures last colour is usedcmap_discrete = mpl.colors.ListedColormap(colors)# Use a simple normalize from 1 to 10norm = mpl.colors.Normalize(vmin=target_min, vmax=target_max+1) # could be +1?iod25_msoa_gpd.plot( column=target_variable, ax=ax, cmap=ice_cmap_rev)plt.title('Index of Multiple Deprivation 2025: MSOAs', ha='center')sm = mpl.cm.ScalarMappable(cmap=cmap_discrete, norm=norm)sm._A = []divider = make_axes_locatable(ax)cax = divider.append_axes("right", size="5%", pad=0.1)# Create colorbarcbar = fig.colorbar(sm, cax=cax)# Set custom ticks at bin centerstick_positions = [i +0.5for i inrange(target_min, target_max+1)] # 1.5, 2.5, ..., 9.5cbar.set_ticks(tick_positions)cbar.set_ticklabels(range(target_min, target_max+1)) # label them 1–10cbar.set_label('Decile')ax.set_axis_off()plt.tight_layout()cx.add_basemap(ax=ax, crs=iod25_msoa_gpd.crs, source=cx.providers.CartoDB.Positron)# fig.savefig(os.path.join('..','assets','images','blog','imd25-msoa.png'),bbox_inches='tight', dpi=300)```New [Indices of Deprivation data](https://www.gov.uk/government/statistics/english-indices-of-deprivation-2025) were released in November 2025. These data provide measures of deprivation in areas relative to other areas in England. The data have been published for Lower layer Super Output Areas (LSOAs) and Local Authority Districts, as well as other area types. However, we've noticed that the data haven't been published at Middle layer Super Output Area (MSOA). In our recent project [Understanding Poverty in Place](https://justknowledge.org.uk/case-studies/child-poverty-analysis.html), we aggregated deprivation data to MSOA level (the estate of Northumberland Park can be defined as a single MSOA), and we'd like to share this aggregated dataset in case it's of use to others. <div style="text-align: center;"><a href="https://github.com/JustKnowledge-UK/public-downloads/releases/download/data-release/iod25_msoa.csv" download><img src="../assets/images/shared/new-knowledge-icon.svg" alt="New Knowledge Icon" style="margin-top: 20px;"/></a><p><strong>Download the MSOA level data</strong></p></div>## More information on how we aggregated these dataTo aggregate LSOA data to MSOA, we followed the guidance set out in Appendix A of the [English Indices of Deprivation Research Report](https://www.gov.uk/government/publications/english-indices-of-deprivation-2025-research-report). In brief, the process involves:1. Creating population weights for each LSOA by dividing the population of each LSOA by the total population of its corresponding MSOA (note some population denominators are specific populations, e.g. children, older people, employed people)2. Multiplying the LSOA deprivation scores by their population weights2. Summing the weighted scores of LSOAs for each MSOAThe result is a population-weighted score for each MSOA, where each LSOA's contribution is weighted by how big its population is relative to the MSOA's total population.For each deprivation metric, we then ranked the MSOAs and allocated each MSOA to a decile, where lower ranks and deciles correspond to greater deprivation.Below is the code used to aggregate the LSOA data to MSOA.```{python}#| output: false#| include: true#| echo: true#| code-fold: true#| code-summary: "Code for Nerds"# Preliminariesimport psycopg2import configparserimport osimport requestsimport pandas as pdfrom sqlalchemy import create_enginefrom sqlalchemy import create_engineimport janitorimport pickle# Load DB configconfig = configparser.ConfigParser()config.read(os.path.join('..','db_config.ini'))db_params =dict(config['postgresql'])# Build SQLAlchemy connection stringconn_str = (f"postgresql+psycopg2://{db_params['user']}:{db_params['password']}"f"@{db_params['host']}:{db_params['port']}/{db_params['database']}")# Create engineengine = create_engine(conn_str)# Get Iod Data from sourcedata_dir = os.path.join('data')filepath = os.path.join(data_dir, 'iod25.csv')url ='https://assets.publishing.service.gov.uk/media/68ff5daabcb10f6bf9bef911/File_7_IoD2025_All_Ranks_Scores_Deciles_Population_Denominators.csv'if os.path.isfile(filepath)==False: response = requests.get(url)withopen(filepath, 'wb') asfile:file.write(response.content)# else:# print('Data already acquired. Loading it.')iod25 = pd.read_csv(filepath)# Clean column namesiod25 = janitor.clean_names(iod25)iod25.columns = iod25.columns.str.strip('_')domains_of_interest = ['index_of_multiple_deprivation','income','employment','education_skills_and_training','health_deprivation_and_disability','crime','barriers_to_housing_and_services','living_environment','income_deprivation_affecting_children','income_deprivation_affecting_older_people','children_and_young_people_sub-domain','adult_skills_sub-domain','geographical_barriers_sub-domain','wider_barriers_sub-domain','indoors_sub-domain','outdoors_sub-domain',]def clean_domain_name(domain):return domain.replace('_', ' ').title()domain_dict = {domain: clean_domain_name(domain) for domain in domains_of_interest}# Reorder columnscols = [ col for col in iod25.columnsif'score'in colandany(domain in col for domain in domains_of_interest)]population_cols = [ col for col in iod25.columns if ('population'in col)or ('dependent_children'in col)]iod25 = iod25.rename( columns = {'lsoa_code_2021': 'lsoa21cd','lsoa_name_2021': 'lsoa21nm','local_authority_district_code_2024': 'lad24cd','local_authority_district_name_2024': 'lad24nm', })iod25 = iod25[['lsoa21cd','lsoa21nm','lad24cd','lad24nm'] + cols + population_cols]# Get the lookup from LSOA to MSOA. This is from our DB. # Lookups are available at ONS geoportal, e.g. https://geoportal.statistics.gov.uk/datasets/45fdd4465604493cb7d2238ad642172b_0/explorefilepath = os.path.join(data_dir, 'lsoa_msoa21_lookup.pkl')ifnot os.path.isfile(filepath):with engine.connect() as con: query ='''SELECT DISTINCT lsoa21cd, msoa21cd FROM pcode_census21_lookup ''' lookup21 = pd.read_sql(query, con = con)withopen(filepath, 'wb') asfile: pickle.dump(lookup21, file)else:withopen(filepath, 'rb') asfile: lookup21 = pickle.load(file)iod25_msoa = iod25.copy()iod25_msoa = iod25_msoa.merge(lookup21, how='left', on='lsoa21cd') cols = iod25_msoa.columns[iod25_msoa.columns.str.contains('score')]# Note - denominator may need to be different for particular domains# Create a dictionary to index the correct population column# These are metrics with specific denominatorsspecial_cols = ['income_deprivation_affecting_children_index_idaci_score_rate','income_deprivation_affecting_older_people_idaopi_score_rate','employment_score_rate']# These are the metrics with the general pop denominatornormal_cols = [col for col in cols if col notin special_cols]# Map the special metrics to specific denomspop_dict = {'income_deprivation_affecting_children_index_idaci_score_rate': 'dependent_children_aged_0_15_mid_2022','income_deprivation_affecting_older_people_idaopi_score_rate': 'older_population_aged_60_and_over_mid_2022','employment_score_rate': 'working_age_population_18_66_for_use_with_employment_deprivation_domain_mid_2022'}# Map the normal metrics to the total pop denomtemp_dict = {col: 'total_population_mid_2022'for col in normal_cols}# Add the two dictspop_dict.update(temp_dict)# Multiply each score by populationfor col in cols: population_col = pop_dict[col]# print(col)# print(population_col) iod25_msoa[col +'_weighted'] = iod25_msoa[col] * iod25_msoa[population_col]# Group by MSOA and sum the weighted scores and populationgrouped = iod25_msoa.groupby(['msoa21cd','lad24cd','lad24nm']).agg( {col +'_weighted': 'sum'for col in cols} | {'total_population_mid_2022': 'sum','dependent_children_aged_0_15_mid_2022': 'sum','older_population_aged_60_and_over_mid_2022': 'sum','working_age_population_18_66_for_use_with_employment_deprivation_domain_mid_2022': 'sum'}).reset_index()# Calculate weighted average, rank, and decilefor col in cols: avg_col = col +'_weighted_avg' rank_col = col +'_rank' decile_col = col +'_decile' population_col = pop_dict[col]# print(col + ': ' + population_col)# print(grouped[population_col]) grouped[avg_col] = grouped[col +'_weighted'] / grouped[population_col] grouped[rank_col] = grouped[avg_col].rank(method='min', ascending=False) grouped[decile_col] = pd.qcut(grouped[rank_col], q=10, labels=range(1, 11), duplicates='drop')# Select final columns to keepiod25_msoa = grouped[['msoa21cd','lad24cd','lad24nm'] + [col + suffix for col in cols for suffix in ['_weighted_avg', '_rank', '_decile']]]iod25_msoa.to_csv(os.path.join('data','iod25_msoa.csv'), index=False)```