New dashboard reveals stop and search disparities vary far more by time and place than national figures suggest
Mitali Sen - 15th September 2026
Just Knowledge’s free Stop and Search Dashboard lets anyone explore how stop and search is used in their own community, making local patterns that are hidden by national statistics much more visible.
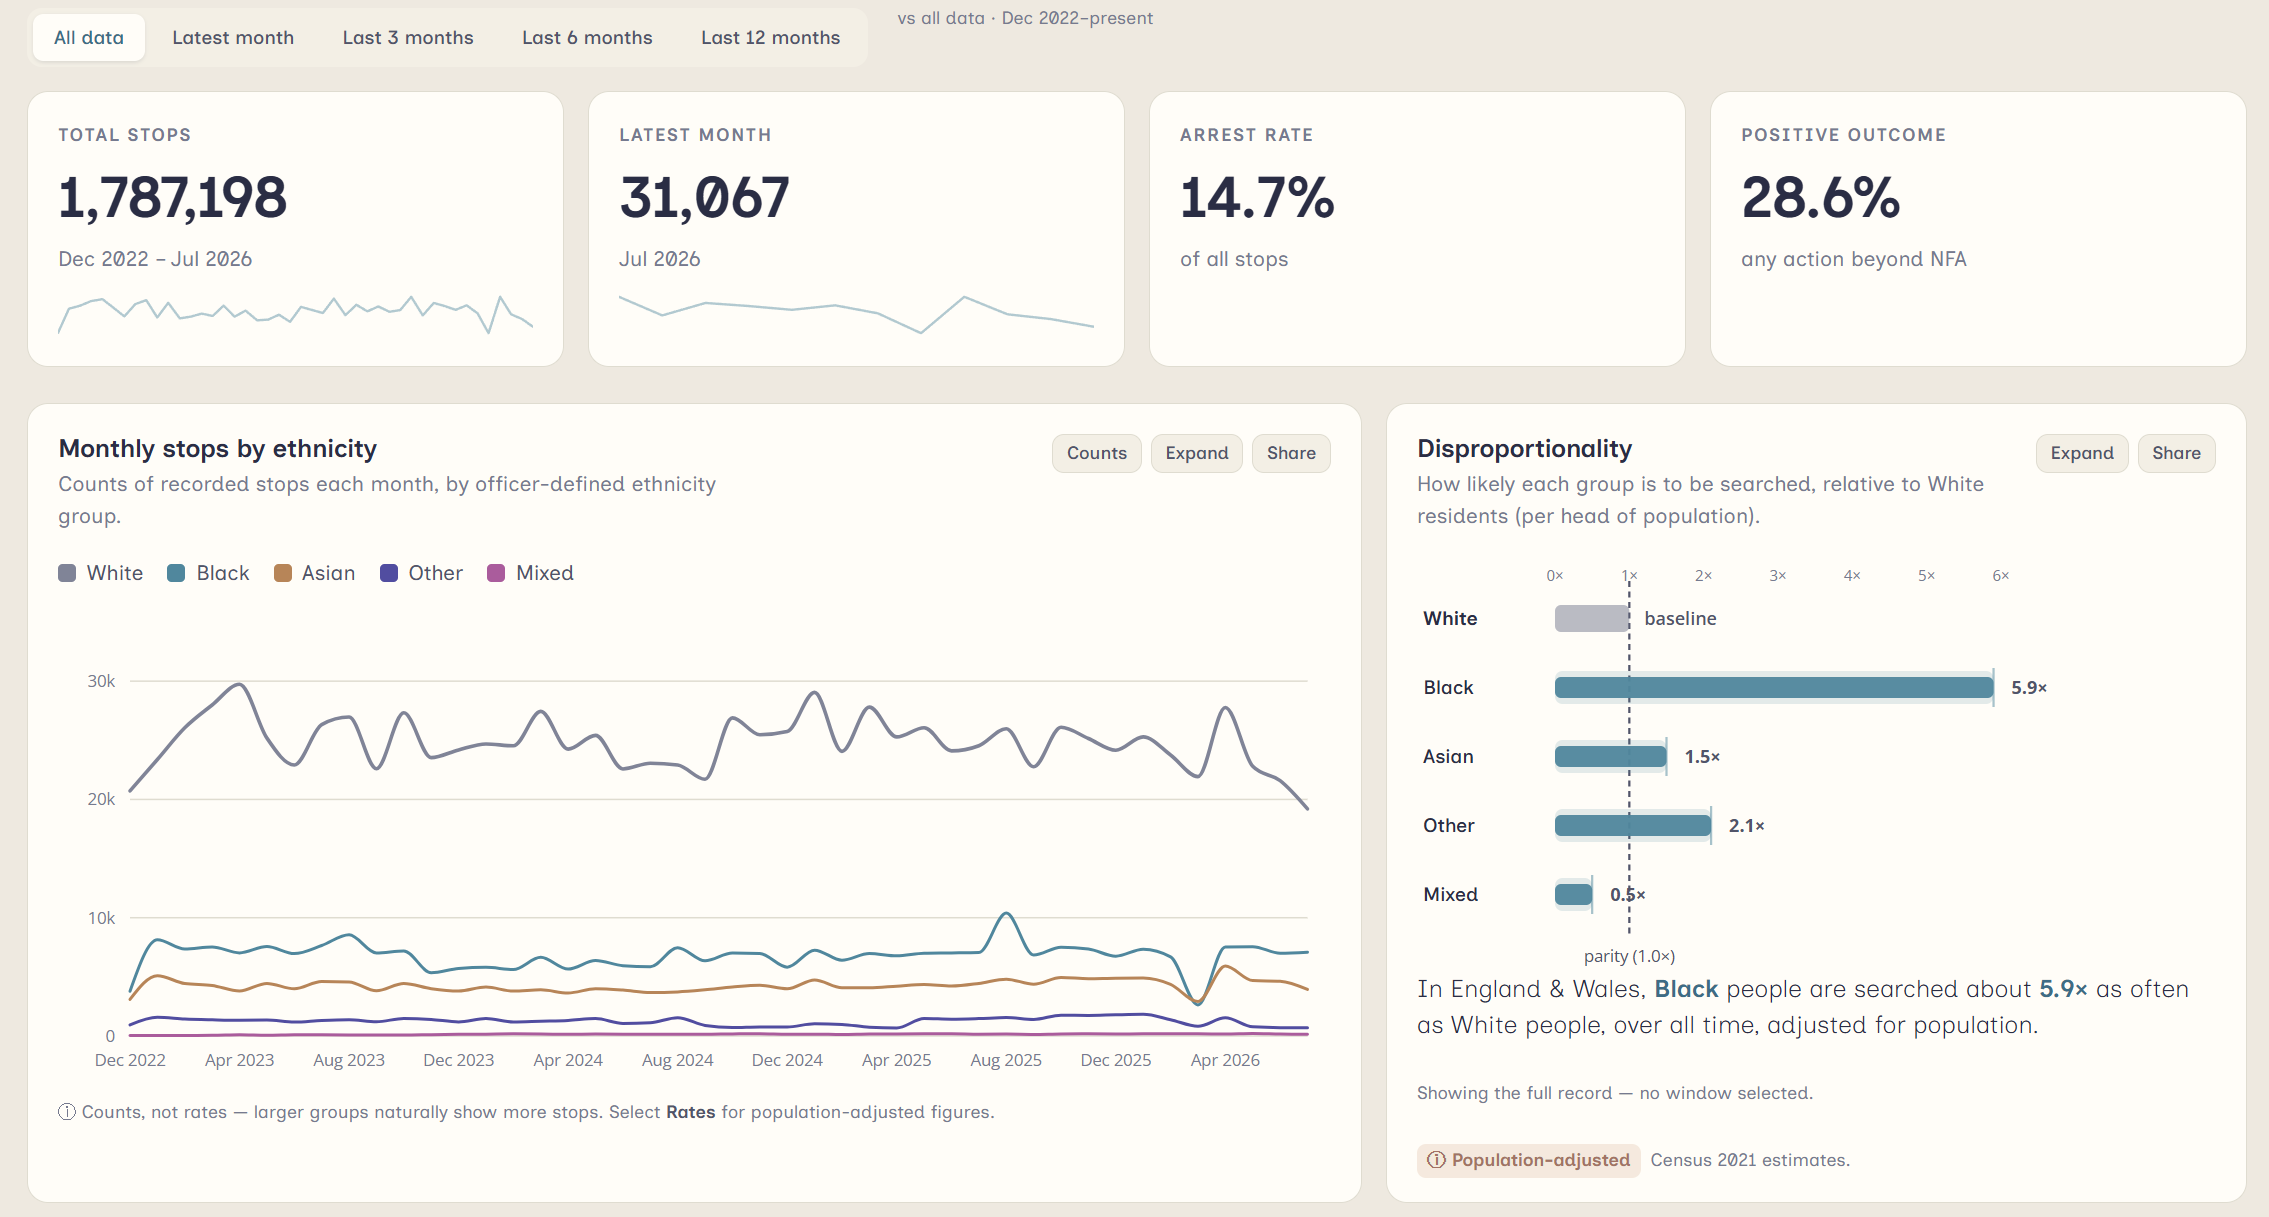
London, 15 September 2026 - On the United Nations’ International Day of Democracy, Just Knowledge, a research organisation working to make data and evidence more accessible and useful to communities, is launching a free public dashboard showing how stop and search disparities vary sharply over time and from place to place. Drawing on official police and ONS data, the tool allows anyone to explore what is happening in their own neighbourhood as far back as 2022, rather than relying on a single national statistic.
The Stop and Search Dashboard uses official stop and search records published by police forces across England and Wales. Users can search by postcode or local authority to see who is being stopped, what they’re searched for, what happens afterwards and how local patterns compare with other areas, including differences between ethnic groups relative to the local population. The data updates every month.
Public debate often centres on a single national statistic: Black people are stopped and searched around four times more often than White people. Yet, Just Knowledge’s analysis shows that national figure conceals much sharper local disparities. In some London neighbourhoods such as Richmond upon Thames, Black residents are stopped at almost 16 times the rate of White residents, while patterns also change significantly over time.
Outside of London, similarly wide disparities emerge. In Brighton and Hove, Black people are stopped and searched at 8.8 times the rate of White people, a wider gap than in more than half of London’s boroughs. In Bristol, the disparity is 5.2× over the last four years, rising to 6× over the past 12 months. The figures show that stop and search disparities are a national issue, not just a London phenomenon.
The dashboard is timely. Recent research highlights a relationship between stop and search activity and mental health; areas with greater mental health challenges tend to be areas that are also subject to a greater amount of stop and search (Kyprianides & Bradford, 2025). Together, the research and dashboard highlight why understanding local patterns of stop and search is so important, rather than treating disproportionality as a single national phenomenon.
The dashboard was co-produced with young Black people in Haringey, in partnership with Mind in Haringey, through a process that enabled community members to interpret quantitative data through the lens of their lived experience. This ensured the tool is grounded in local knowledge and responsive to local needs. Haringey was chosen deliberately, given its long history of strained relations between the police and the Black community.
While the national dashboard provides key metrics for broad comparison, the co-production process revealed a clear appetite for more detailed, locally specific insights. Just Knowledge is now offering to work with partners in other boroughs to develop bespoke local versions, using the same approach.
The dashboard is built on policedatR, an open-source R package developed by Just Knowledge’s co-founders to retrieve and clean stop and search data from data.police.uk. The package is described in a peer-reviewed paper published in the journal Crime Science (Miles-Wilson & Okoroji, 2026).
The launch date is deliberate. The United Nations’ International Day of Democracy celebrates the principle that people should have a meaningful voice in decisions that affect their lives. Just Knowledge’s flagship methodology, Data Democracy, applies this principle to evidence, arguing that communities should shape both the questions research asks, as well as how data about their lives is interpreted and used.
By making local stop and search data freely accessible, the organisation hopes to create a small piece of democratic infrastructure - giving communities the same opportunity to interrogate evidence that informs public debate as the institutions that collect it.
Dr Jolyon Miles-Wilson, Co-Founder of Just Knowledge, said:
“We often talk about stop and search as though there’s one national story. There isn’t. What’s happening in one community can look very different from another. We built this dashboard so anyone can explore what’s happening where they live, using the same data that policymakers and researchers rely on. Better conversations start with better access to evidence.”
Lynette Charles, CEO of Mind in Haringey, said:
“What’s made the partnership with Just Knowledge valuable is that the research connects to what our communities experience. The people most affected are shaping what the evidence means and what should be done about it. That’s not how research usually works.”
The Stop and Search Dashboard is free to use and available now at stop-and-search.justknowledge.org.uk.. Just Knowledge is inviting feedback from residents, journalists, researchers and community organisations on how they are using it.
This work was supported by funding from the Wellcome Trust as part of its wider programme on health, wellbeing and Black communities.
Notes
Data and methodology
Stop counts are drawn from data.police.uk, the official open release, published under the Open Government Licence v3.0. Recording practices vary between police forces and over time, so differences between areas may reflect recording practice as well as policing activity, particularly for the most recent data. Rates are adjusted for population using ONS Census 2021 figures. Where a breakdown would rest on fewer than 30 stops, it is suppressed to protect reliability. Disparities should be understood as a starting point for further questions rather than proof of bias.
Existing dashboards
The Metropolitan Police also publishes a stop and search dashboard but this is restricted to London and the most recent 24 months. Just Knowledge’s dashboard is independent, covers the whole of England and Wales and runs back to 2022, enabling users to explore longer-term patterns.
The advocacy group StopWatch also publishes a free public stop and search dashboard covering England and Wales. Its dataset extends back more than ten years and provides a valuable long-term view of stop and search at police force level. Just Knowledge’s dashboard complements this by offering more granular analysis at local authority and postcode level.
Bibliography
Kyprianides, A., & Bradford, B. (2025). Intersections between policing and mental health at the neighbourhood level: Evidence from England. International Journal of Police Science & Management, 27(2), 144-158. https://doi.org/10.1177/14613557241293004
Miles-Wilson, J., Okoroji, C. policedatR: a comprehensive R package for stop and search data in England and Wales. Crime Sci 15, 11 (2026). https://doi.org/10.1186/s40163-025-00266-6
policedatR on GitHub: https://github.com/JustKnowledge-UK/policedatR
Stop and Search Data for England & Wales. (n.d.). Just Knowledge. Retrieved 15 September 2026, from https://stop-and-search.justknowledge.org.uk/